This study compared the performances of six options-based strategy indexes to traditional investment indexes. The six options-based strategies, which all write options on the Russell 2000® (RUT) Index, are as follows:
1) BXR – CBOE Russell 2000 BuyWrite Index;
2) CLLR - CBOE Russell 2000 Zero-Cost Put Spread Collar Index;
3) BXRC - CBOE Russell 2000 Conditional BuyWrite Index;
4) BXRD - CBOE Russell 2000 30-Delta BuyWrite Index;
5) PUTR - CBOE Russell 2000 PutWrite Index;
6) WPTR - CBOE Russell 2000 One-Week PutWrite Index.
The following items highlight key results of the study (all analyses were done through the end of 2015):
1) Growth of Options Volume: The average daily contract volume of the Russell 2000® index options traded at the CBOE grew more than 2000% from 2004 to 2015. (Exhibit 1)
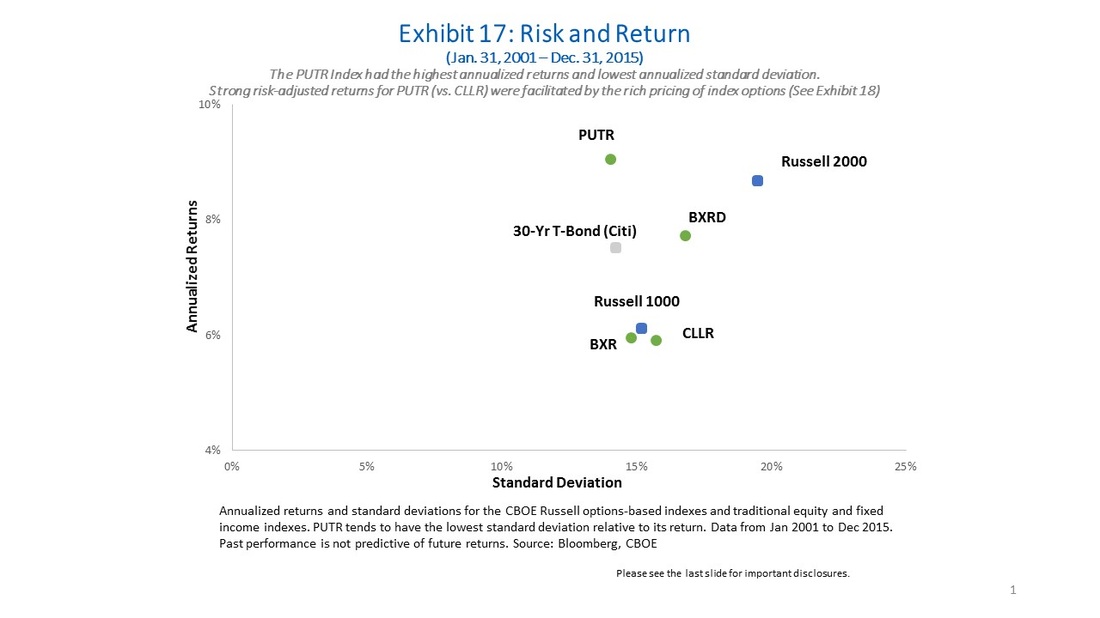
2)Risk-adjusted Returns: Since 2001 the CBOE Russell 2000 PutWrite Index (PUTR) had higher returns, lower volatility and higher Sharpe Ratio than both the Russell 2000 Index and Citigroup 30-Year Treasury Bond Index. (Exhibits 5, 6, 7, and 13)
3) Options Premium Income: In 2015 the aggregate gross premium (as a percentage of the underlying) was 41.4% for the CBOE Russell 2000 One-Week PutWrite Index (WPTR), 22.2% for the CBOE Russell 2000 PutWrite Index (PUTR), 19.5% for the CBOE Russell 2000 BuyWrite Index (BXR), and 9.2% for the CBOE Russell 2000 30-Delta BuyWrite Index (BXRD). (Exhibit 19)
4) Lower Volatility: Since 2001 the PUTR, BXR, CLLR & BXRD indexes had a lower annualized standard deviation than the Russell 2000 Index. The reduction ranged from 14% to 28% lower. The options-based indexes also had lower betas (ranging from 0.59 to 0.82) than the Russell 2000 Index. (Exhibits 7 & 13)
5) Less Maximum Drawdown: Since 2001 the maximum drawdowns for the PUTR, BXR, CLLR & BXRD indexes averaged 21% less than the Russell 2000 Index. (Exhibit 8)
6) Faster Average Recovery (in months): Since 2001 the PUTR Index average recovery time was 21% faster from the drawdown troughs than the Russell 2000 Index. (Exhibit 10)
7) Richly Priced Index Options: Since 2004 the implied volatility for the Russell 2000 has averaged about 2.88 volatility points higher than its realized volatility, and the rich pricing for index options may have facilitated higher returns for option-selling indexes such as PUTR and BXRD (when compared with the CBOE Russell 2000 Zero-Cost Spread Collar Index (CLLR)). (Exhibits 6 and 18)
8) Tail Risk: During the five years when the Russell 2000 return was negative, the PUTR and CLLR indexes had higher returns than the Russell 2000 Index. (Exhibit 26)
Click here for the entire paper
Mark Shore has more than 25 years of experience in the futures markets and managed futures, publishes research, consults on alternative investments & conducts educational workshops.
www.shorecapmgmt.com email: info@shorecapmgmt.com
Mark Shore is also an Adjunct Professor at DePaul University’s Kellstadt Graduate School of Business, where he teaches the only known accredited managed futures course in the country. He is also a Board Member of the Arditti Center for Risk Management at DePaul University.
Past performance is not necessarily indicative of future results. There is risk of loss when investing in futures and options. Futures and options can be a volatile and risky investment; only use appropriate risk capital; this investment is not for everyone. The opinions expressed are solely those of the author and are only for educational purposes. Please talk to your financial advisor before making any investment decisions.
0 Comments





 RSS Feed