By Mark Shore
Our series of trading strategies for the CBOE Volatility Index® (VIX®) futures contract traded on CBOE Futures Exchange, LLC (CFE®), have discussed various VIX futures trading ideas. This article discusses the Mass Index. As the VIX futures tends to be a range bound product, this strategy may be of special interest to our readers as it seeks market turning points.
First let's examine the recent liquidity of CFE. On June 3, 2013, an increased volume of 59% was reported for May 2013 versus May 2012. The volume was 3,220,913 in May 2013 versus 2,022,253 in May 2012.i Year-to-date volume was 16,534,805 for 2013 versus 7,838,325 for 2012, an increase of 111%.
Specific to VIX futures, May 2013 experienced trading volume of 3,212,399, the third highest month, behind March and April 2013 (3,220,977 and 4,056,760 respectively) and 61% higher than May 2012. The month of May was the fourth consecutive month in the contract's history of trading volume exceeding 3 million contracts. In May 2013 the monthly average daily volume was 146,018 versus 90,908 in May 2012, an increase of 61%.
The Mass Index was developed by Donald Dorsey and was initially discussed in the June 1992 issue of Technical Analysis of Stocks and Commodities magazine. The Mass Index seeks to identify trend reversals for overbought and oversold markets. This is measured by the increasing or decreasing of the market's range between high and low prices. The Mass Index will increase as the range increases and will decrease as the range decreases.
The Mass Index is a 25-period moving sum of the ratio of two moving averages. The first average is a 9-period exponentially moving average of the high and the low differential. The second average is a 9-period exponential moving average of the first average. Increasing the sum widens the gap and the Mass Index moves higher.ii
Dorsey refers to the "reversal bulge" as an important Mass Index pattern for a high probability of the market reversing direction. This tends to occur when the Mass Index exceeds 27 and quickly falls below 26.5. To determine the reversal direction of the move, buy if the 9-period exponential moving average of the market is trending down and sell if the 9-period exponential moving average is trending up.iii However, a reversal bulge may be an infrequent occurrence.
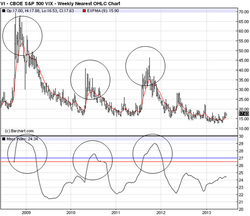
In Chart 1 noted below, the near-term VIX futures contract offers suggests times when the reversal bulge appears. In each case the VIX futures contract was at or near its historical resistance level then began a sell off that lasted several months.
In October 2008 (during the financial crisis) VIX futures reached a high of 69.40 and the Mass Index signaled an overbought market since late September / early October 2008. Between March 23 and March 29, 2009, the reversal bulge appeared as the Mass Index fell below 26.5. The exponential 9-week moving average was higher as the market rallied. This would then be a signal to short VIX futures. This signal lasted into early 2010.
Between July 26, 2010 and Oct 11, 2010, the reversal bulge signal appeared again. The exponential 9-week moving average was signaling a short position. This signal lasted until early or mid 2011.
In the last few months of 2011, the Mass Index indicated an overbought position. During January, the Mass Index signaled a shorting signal for VIX futures. This signal lasted into May or June of 2012. Basis, weekly data and the Mass Index does not offer frequent signals, but they tend to offer signals when the market is overbought and the reversal may last for several months.
Chart 1: VIX Futures Weekly Nearest Futures with a 9 Day Exponential Moving Average and Mass Index, Ending June 18, 2013
Our series of trading strategies for the CBOE Volatility Index® (VIX®) futures contract traded on CBOE Futures Exchange, LLC (CFE®), have discussed various VIX futures trading ideas. This article discusses the Mass Index. As the VIX futures tends to be a range bound product, this strategy may be of special interest to our readers as it seeks market turning points.
First let's examine the recent liquidity of CFE. On June 3, 2013, an increased volume of 59% was reported for May 2013 versus May 2012. The volume was 3,220,913 in May 2013 versus 2,022,253 in May 2012.i Year-to-date volume was 16,534,805 for 2013 versus 7,838,325 for 2012, an increase of 111%.
Specific to VIX futures, May 2013 experienced trading volume of 3,212,399, the third highest month, behind March and April 2013 (3,220,977 and 4,056,760 respectively) and 61% higher than May 2012. The month of May was the fourth consecutive month in the contract's history of trading volume exceeding 3 million contracts. In May 2013 the monthly average daily volume was 146,018 versus 90,908 in May 2012, an increase of 61%.
The Mass Index was developed by Donald Dorsey and was initially discussed in the June 1992 issue of Technical Analysis of Stocks and Commodities magazine. The Mass Index seeks to identify trend reversals for overbought and oversold markets. This is measured by the increasing or decreasing of the market's range between high and low prices. The Mass Index will increase as the range increases and will decrease as the range decreases.
The Mass Index is a 25-period moving sum of the ratio of two moving averages. The first average is a 9-period exponentially moving average of the high and the low differential. The second average is a 9-period exponential moving average of the first average. Increasing the sum widens the gap and the Mass Index moves higher.ii
Dorsey refers to the "reversal bulge" as an important Mass Index pattern for a high probability of the market reversing direction. This tends to occur when the Mass Index exceeds 27 and quickly falls below 26.5. To determine the reversal direction of the move, buy if the 9-period exponential moving average of the market is trending down and sell if the 9-period exponential moving average is trending up.iii However, a reversal bulge may be an infrequent occurrence.
In Chart 1 noted below, the near-term VIX futures contract offers suggests times when the reversal bulge appears. In each case the VIX futures contract was at or near its historical resistance level then began a sell off that lasted several months.
In October 2008 (during the financial crisis) VIX futures reached a high of 69.40 and the Mass Index signaled an overbought market since late September / early October 2008. Between March 23 and March 29, 2009, the reversal bulge appeared as the Mass Index fell below 26.5. The exponential 9-week moving average was higher as the market rallied. This would then be a signal to short VIX futures. This signal lasted into early 2010.
Between July 26, 2010 and Oct 11, 2010, the reversal bulge signal appeared again. The exponential 9-week moving average was signaling a short position. This signal lasted until early or mid 2011.
In the last few months of 2011, the Mass Index indicated an overbought position. During January, the Mass Index signaled a shorting signal for VIX futures. This signal lasted into May or June of 2012. Basis, weekly data and the Mass Index does not offer frequent signals, but they tend to offer signals when the market is overbought and the reversal may last for several months.
Chart 1: VIX Futures Weekly Nearest Futures with a 9 Day Exponential Moving Average and Mass Index, Ending June 18, 2013

Source: www.barchart.com
Read More
Follow Mark Shore on Twitter, Facebook and Linkedin
i"May 2013 Trading Volume in VIX Futures Post Gains Over a Year Ago" CFE Press Release June 3, 2013
iiwww.barchart.com
iiiAchelis, S. (2001). Technical Analysis from A to Z. New York, McGraw-Hill, 181:183
Copyright ©2013 Mark Shore. Contact the author for permission for republication at [email protected] Mark Shore has more than 20 years of experience in the futures markets and managed futures, publishes research, consults on alternative investments and conducts educational workshops. www.shorecapmgmt.com
Mark Shore is also an Adjunct Professor at DePaul University's Kellstadt Graduate School of Business in Chicago where he teaches a managed futures / global macro course and an Adjunct at the New York Institute of Finance. Mark is a contributing writer to Reuters HedgeWorld.
Past performance is not necessarily indicative of future results. There is risk of loss when investing in futures and options. Always review a complete CTA disclosure document before investing in any Managed Futures program. Managed futures can be a volatile and risky investment; only use appropriate risk capital; this investment is not for everyone. The opinions expressed are solely those of the author and are only for educational purposes. Please talk to your financial advisor before making any investment decisions.
 RSS Feed
