By Mark Shore
Continuing the series of discussing various methods of trading the CBOE Volatility Index® (VIX®) futures contract at CBOE Futures Exchange, LLC (CFE), we will discuss the utility of the True Range indicator and the Average True Range indicator. In previous articles we discussed the use of spreading, correlations, moving averages and the Aroon indicator as methods of trading VIX futures.
Liquidity is an important factor of risk management. CFE announced on November 1, 2012, record volume in October 2012 for both the VIX futures contract and total volume of the Exchange. VIX futures reached a record 2,443,878 contracts traded in October 2012, a 172% increase from October 2011 and a 2% increase from September 2012. The October 2012 Average Daily Volume was 116,375 contracts, a 172% increase from October 2011 and a decrease of 8% from September 2012. However, the markets were closed for two days in October due to hurricane Sandy.i
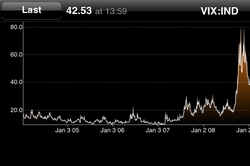
In previous articles we discussed VIX futures as a mean-reverting market tending to find major price support between 10 and 15 and major price resistance around 40. However, within this range, market turning points do develop from time to time. The True Range indicator is a method of seeking changes in market momentum.
The True Range indicator and the Average True Range were developed by Welles Wilder, also known for developing the Relative Strength index, Directional Movement and the Parabolic Stop and Reverse. True Range is considered a metric of a market's activity or volatility. Wilder first published the True Range indicator in his 1978 book "New Concepts in Technical Trading Systems". The True Range indicator posits that the higher the number, the more likely the market will change direction. A lower number would indicate a weaker trend or indication of a sideways market. The True Range is defined as the maximum value of the following: 1) today's high to today's low; 2) yesterday's close to today's high; and 3) yesterday's close to today's low. The Average True Range is a moving average of the True Range.
VIX futures are an indicator of S&P 500 Index volatility and True Range is a volatility of the volatility or a second derivative of the READ MORE
Copyright ©2012 Mark Shore. Contact the author for permission for republication at [email protected] Mark Shore has more than 20 years of experience in the futures markets and managed futures, publishes research, consults on alternative investments and conducts educational workshops. www.shorecapmgmt.com
Mark Shore is also an Adjunct Professor at DePaul University's Kellstadt Graduate School of Business in Chicago where he teaches a managed futures / global macro course and an Adjunct at the New York Institute of Finance. Mark is a contributing writer to Reuters HedgeWorld.
Past performance is not necessarily indicative of future results. There is risk of loss when investing in futures and options. Always review a complete CTA disclosure document before investing in any Managed Futures program. Managed futures can be a volatile and risky investment; only use appropriate risk capital; this investment is not for everyone. The opinions expressed are solely those of the author and are only for educational purposes. Please talk to your financial advisor before making any investment decisions.
Continuing the series of discussing various methods of trading the CBOE Volatility Index® (VIX®) futures contract at CBOE Futures Exchange, LLC (CFE), we will discuss the utility of the True Range indicator and the Average True Range indicator. In previous articles we discussed the use of spreading, correlations, moving averages and the Aroon indicator as methods of trading VIX futures.
Liquidity is an important factor of risk management. CFE announced on November 1, 2012, record volume in October 2012 for both the VIX futures contract and total volume of the Exchange. VIX futures reached a record 2,443,878 contracts traded in October 2012, a 172% increase from October 2011 and a 2% increase from September 2012. The October 2012 Average Daily Volume was 116,375 contracts, a 172% increase from October 2011 and a decrease of 8% from September 2012. However, the markets were closed for two days in October due to hurricane Sandy.i
In previous articles we discussed VIX futures as a mean-reverting market tending to find major price support between 10 and 15 and major price resistance around 40. However, within this range, market turning points do develop from time to time. The True Range indicator is a method of seeking changes in market momentum.
The True Range indicator and the Average True Range were developed by Welles Wilder, also known for developing the Relative Strength index, Directional Movement and the Parabolic Stop and Reverse. True Range is considered a metric of a market's activity or volatility. Wilder first published the True Range indicator in his 1978 book "New Concepts in Technical Trading Systems". The True Range indicator posits that the higher the number, the more likely the market will change direction. A lower number would indicate a weaker trend or indication of a sideways market. The True Range is defined as the maximum value of the following: 1) today's high to today's low; 2) yesterday's close to today's high; and 3) yesterday's close to today's low. The Average True Range is a moving average of the True Range.
VIX futures are an indicator of S&P 500 Index volatility and True Range is a volatility of the volatility or a second derivative of the READ MORE
Copyright ©2012 Mark Shore. Contact the author for permission for republication at [email protected] Mark Shore has more than 20 years of experience in the futures markets and managed futures, publishes research, consults on alternative investments and conducts educational workshops. www.shorecapmgmt.com
Mark Shore is also an Adjunct Professor at DePaul University's Kellstadt Graduate School of Business in Chicago where he teaches a managed futures / global macro course and an Adjunct at the New York Institute of Finance. Mark is a contributing writer to Reuters HedgeWorld.
Past performance is not necessarily indicative of future results. There is risk of loss when investing in futures and options. Always review a complete CTA disclosure document before investing in any Managed Futures program. Managed futures can be a volatile and risky investment; only use appropriate risk capital; this investment is not for everyone. The opinions expressed are solely those of the author and are only for educational purposes. Please talk to your financial advisor before making any investment decisions.
 RSS Feed
