In the continuing series of discussing methods of trading the CBOE Volatility Index® (VIX®) futures contract traded on CBOE Futures Exchange, LLC (CFE®), this article will discuss utilizing the Commodity Channel Index (CCI).
In each article, readers are reminded that the liquidity of a trading instrument is always very important. On March 1, 2013, CFE again reported a continuing trend of increased volume in the VIX futures contract. Specifically, February 2013 was the second consecutive month that achieved record average daily volume, total volume and single-day volume for the VIX futures contract and for CFE.i
The average daily volume (ADV) for the VIX futures contract reached a record 161,176 contracts traded. This was an increase of 141% from February 2012 and an increase of 17% from January of 2013. February 25 and 26, 2013 experienced record volume days of 302,278 and 299,566 contracts traded respectively. This was also the first time that the VIX futures daily volume exceeded 300,000 contracts. The previously single-day record volume of 221,323 contracts was set on January 2, 2013. In February 2013, 3,062,344 VIX futures contracts were traded, representing an increase of 129% from February 2012. February 2013 trading represented a 6% increase from the record of 2,897,739 traded contracts set in January 2013. February 2013 was the sixth consecutive month in which trading exceeding two million VIX futures contracts and it was the first month in which trading exceeded 3 million VIX futures contracts.
The CCI was developed by Donald Lambert and introduced in the October 1980 issue of Commodities magazine (aka Futures magazine). Application of the CCI is not limited to physical commodities and may apply to financial instruments as well. The CCI is a metric of an investment's variance from its statistical mean. The CCI reports high values when a market reaches an extended high price relative to its average price. It will report low values when a market reaches an extended low price relative to its average price. In basic terms, the CCI is an overbought/ oversold indicator.ii
The CCI is based on the premise that all markets have cycles from low to low or high to high. The CCI is calculated by calculating a typical price of the day from the high + low + close and then creating a simple moving average of the typical price. The final equation of the CCI = (typical price – moving average)/ (0.015* mean deviation). Lambert applies a constant of 0.015 to keep 70% to 80% of the CCI value between +100 and -100.iii
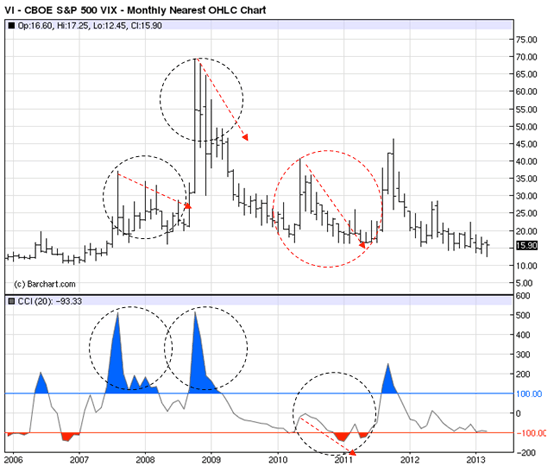
The CCI is considered overbought when the value exceeds +100 and is considered oversold when the value is below -100. However the CCI may extend beyond +100 and -100 and the market could remain overbought/ oversold for an extended period of time. If a market continues to remain overbought/ oversold, but the CCI is reversing (divergence appears) it may imply the market is nearing a correction. Some examples of divergence are provided in this article.
Parameters of the CCI are based on cyclical periods of the market. For this article we assumed a 60 day cycle, using a 20 day (1/3 of the cycle) CCI parameter setting. The lower the parameter setting, the greater the probability of the CCI to reach overbought/ oversold values.
Chart 1: Nearest Monthly VIX Futures Chart, 20 Month CCI
i"Trading Volume in VIX Futures reaches New All-Time High for Second Consecutive Month", March 1, 2013, CFE Press Release
iiAchelis, S. (2001). Technical Analysis from A to Z. New York, McGraw-Hill, 103:106
iiiwww.barchart.com
Copyright ©2013 Mark Shore. Contact the author for permission for republication at [email protected] Mark Shore has more than 20 years of experience in the futures markets and managed futures, publishes research, consults on alternative investments and conducts educational workshops. www.shorecapmgmt.com
Mark Shore is also an Adjunct Professor at DePaul University's Kellstadt Graduate School of Business in Chicago where he teaches a managed futures / global macro course and an Adjunct at the New York Institute of Finance. Mark is a contributing writer to Reuters HedgeWorld.
Past performance is not necessarily indicative of future results. There is risk of loss when investing in futures and options. Always review a complete CTA disclosure document before investing in any Managed Futures program. Managed futures can be a volatile and risky investment; only use appropriate risk capital; this investment is not for everyone. The opinions expressed are solely those of the author and are only for educational purposes. Please talk to your financial advisor before making any investment decisions.

 RSS Feed
