
Chicago PRMIA (Professional Risk Management International Association) Presents:
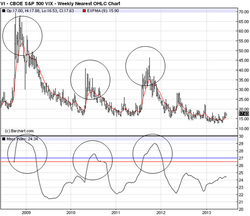
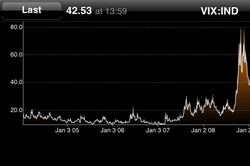
Volatility Products for Risk Management
Join Chicago PRMIA for an evening of discussion with experts on volatility products. From research to product application including VIX, VSTOXX and options. Different tools, perspectives and strategies for different applications.
Any questions in advance for the speakers may be emailed to [email protected]
Speakers Include:
Cem Karsan, AEGEA Capital
Mike Kimbarovsky, Advocate Asset Management
Mark Shore, Shore Capital Management / DePaul University
Monday May 19th, 2014
READ MORE
Follow Mark Shore on Twitter, Facebook and Linkedin
Mark Shore has more than 25 years of experience in the futures markets and managed futures, publishes research, consults on alternative investments and conducts educational workshops. www.shorecapmgmt.com
Mark Shore is also an Adjunct Professor at DePaul University’s Kellstadt Graduate School of Business, where he teaches the only known accredited managed futures course in the country. He is also a Board Member of the Arditti Center for Risk Management at DePaul University.


 RSS Feed
